Note
Go to the end to download the full example code.
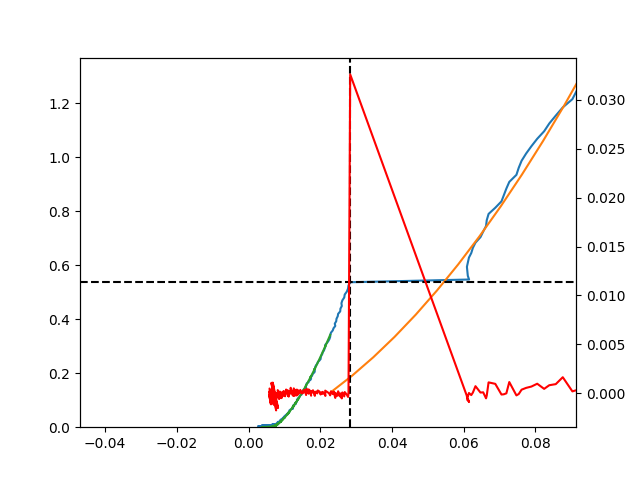
Agilent Pop-In Detection
This example loads an Agilent XLS file, detects pop-in events in each test, and plots the indentation curve with the strongest detected depth jump.
from pathlib import Path
import warnings

import matplotlib
import pandas as pd

matplotlib.use("Agg")
warnings.filterwarnings("ignore", message="FigureCanvasAgg is non-interactive")

import micromechanics
from micromechanics.indentation import Indentation

repository_root = Path(micromechanics.__file__).resolve().parents[1]
file_name = repository_root / "examples" / "Agilent" / "Popin.xls"
Load the multi-test Agilent workbook. Iterating over an Indentation object
advances through the individual tests/sheets in the file.
indentation = Indentation(str(file_name), output={"verbose": 0})
rows = []
popIn searches for a sudden depth jump in the loading curve. Besides the
force at the jump, it returns diagnostic values that help rank how clear the
event is in each test.
for testname in indentation:
  popin_force, certainty = indentation.popIn(plot=False)
  rows.append({
    "test": testname,
    "popin_force_mN": popin_force,
    "delta_depth_um": certainty["deltaH"],
    "delta_slope": certainty["deltaSlope"],
    "second_rate": certainty["secondRate"],
  })

df = pd.DataFrame(rows)
print(df)
        test  popin_force_mN  delta_depth_um  delta_slope  second_rate
0   Test 012        0.346467        0.022570    14.744459     0.002612
1   Test 011        0.388568        0.023260    13.608586     0.002320
2   Test 010        0.351914        0.021471    12.161255     0.002480
3   Test 009        0.358461        0.021948    13.076774     0.002698
4   Test 008        0.215101        0.015592    11.887798     0.002257
5   Test 007        0.379873        0.022317    12.478823     0.002018
6   Test 006        0.464367        0.026628    13.680043     0.002501
7   Test 005        0.341379        0.009847    -1.015436     0.004474
8   Test 004        0.536568        0.021175    18.528137     0.002860
9   Test 003        0.229311        0.012632    11.691769     0.003736
10  Test 002        0.536797        0.033150    17.642043     0.001681
11  Test 001        0.507274        0.029375    17.635183     0.002708
Plot the test with the largest detected depth jump. Reopening the file resets the iterator, making it easy to revisit one selected test and request the diagnostic plot only for that curve.
best_test = df.sort_values("delta_depth_um", ascending=False).iloc[0]["test"]

indentation = Indentation(str(file_name), output={"verbose": 0})
for testname in indentation:
  if testname == best_test:
    indentation.popIn(plot=True)
    break
Total running time of the script: (0 minutes 0.307 seconds)