Tip Area Function
Use the Tip Area Function tab when you want to calibrate the tip area
function from a reference dataset, typically fused silica.
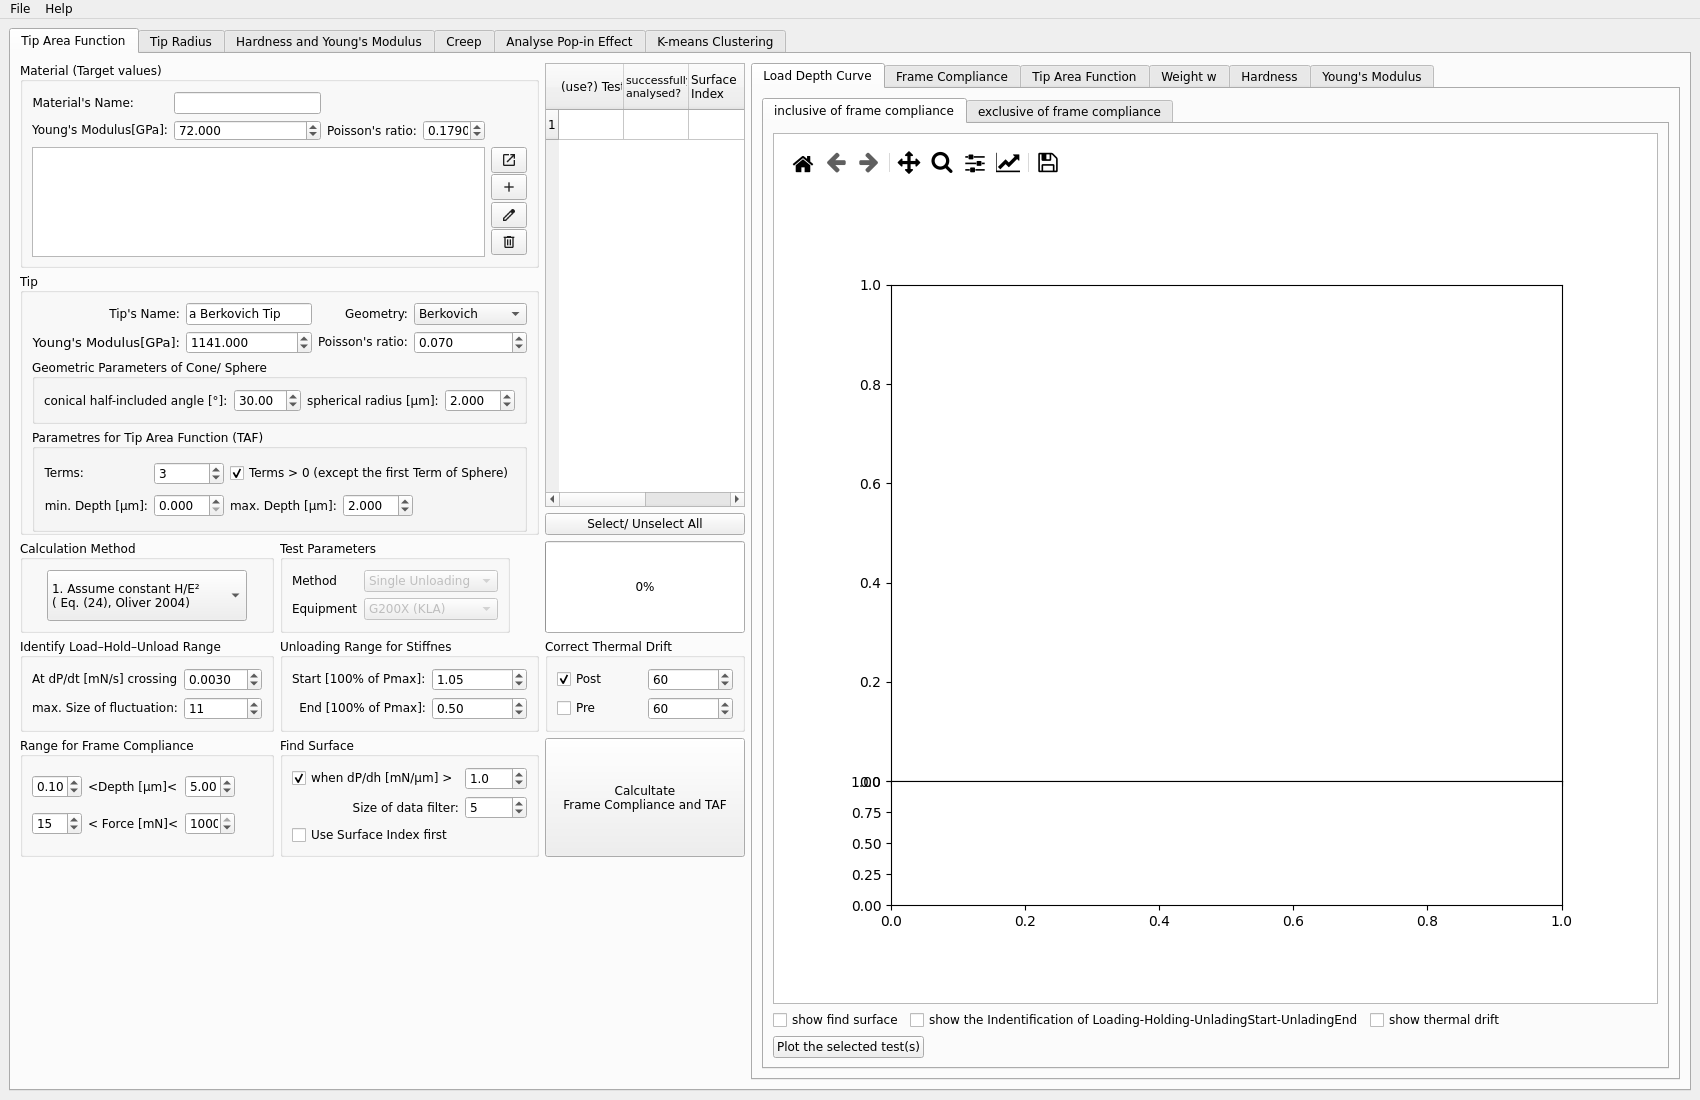
Inputs
a reference file
material parameters
fitting range and TAF settings
Typical steps
Load the fused silica reference file.
Set the material and tip parameters.
Choose the fitting range.
Run the TAF calibration.
Inspect the generated plots.
Copy the calibrated TAF into the reference fields if needed.
Outputs to inspect
Important outputs include:
frame stiffness plot
TAF plot
hardness and modulus plots
interactive weight
wplot
Key plots
The most informative plots in this workflow are:
the TAF plot, to judge the fitted area function
the frame stiffness plot, to check stability of the calibration
the hardness and modulus plots, to see whether the calibrated TAF behaves reasonably over depth
the weight
wplot, to inspect how the fitting weight is distributed
Common problems
Typical issues include:
using the wrong reference dataset
choosing a fitting range that is too narrow or unstable
copying an outdated TAF into later tabs
accepting a fit without checking the weight
wand hardness/modulus plots
Next step
After TAF is calibrated, the usual next step is Frame Compliance or directly Hardness and Young’s Modulus, depending on your workflow.