Hardness and Young’s Modulus
Use the Hardness and Young's Modulus tab after TAF and frame compliance are
ready.
Inputs
one or more test files
calibrated TAF
frame compliance
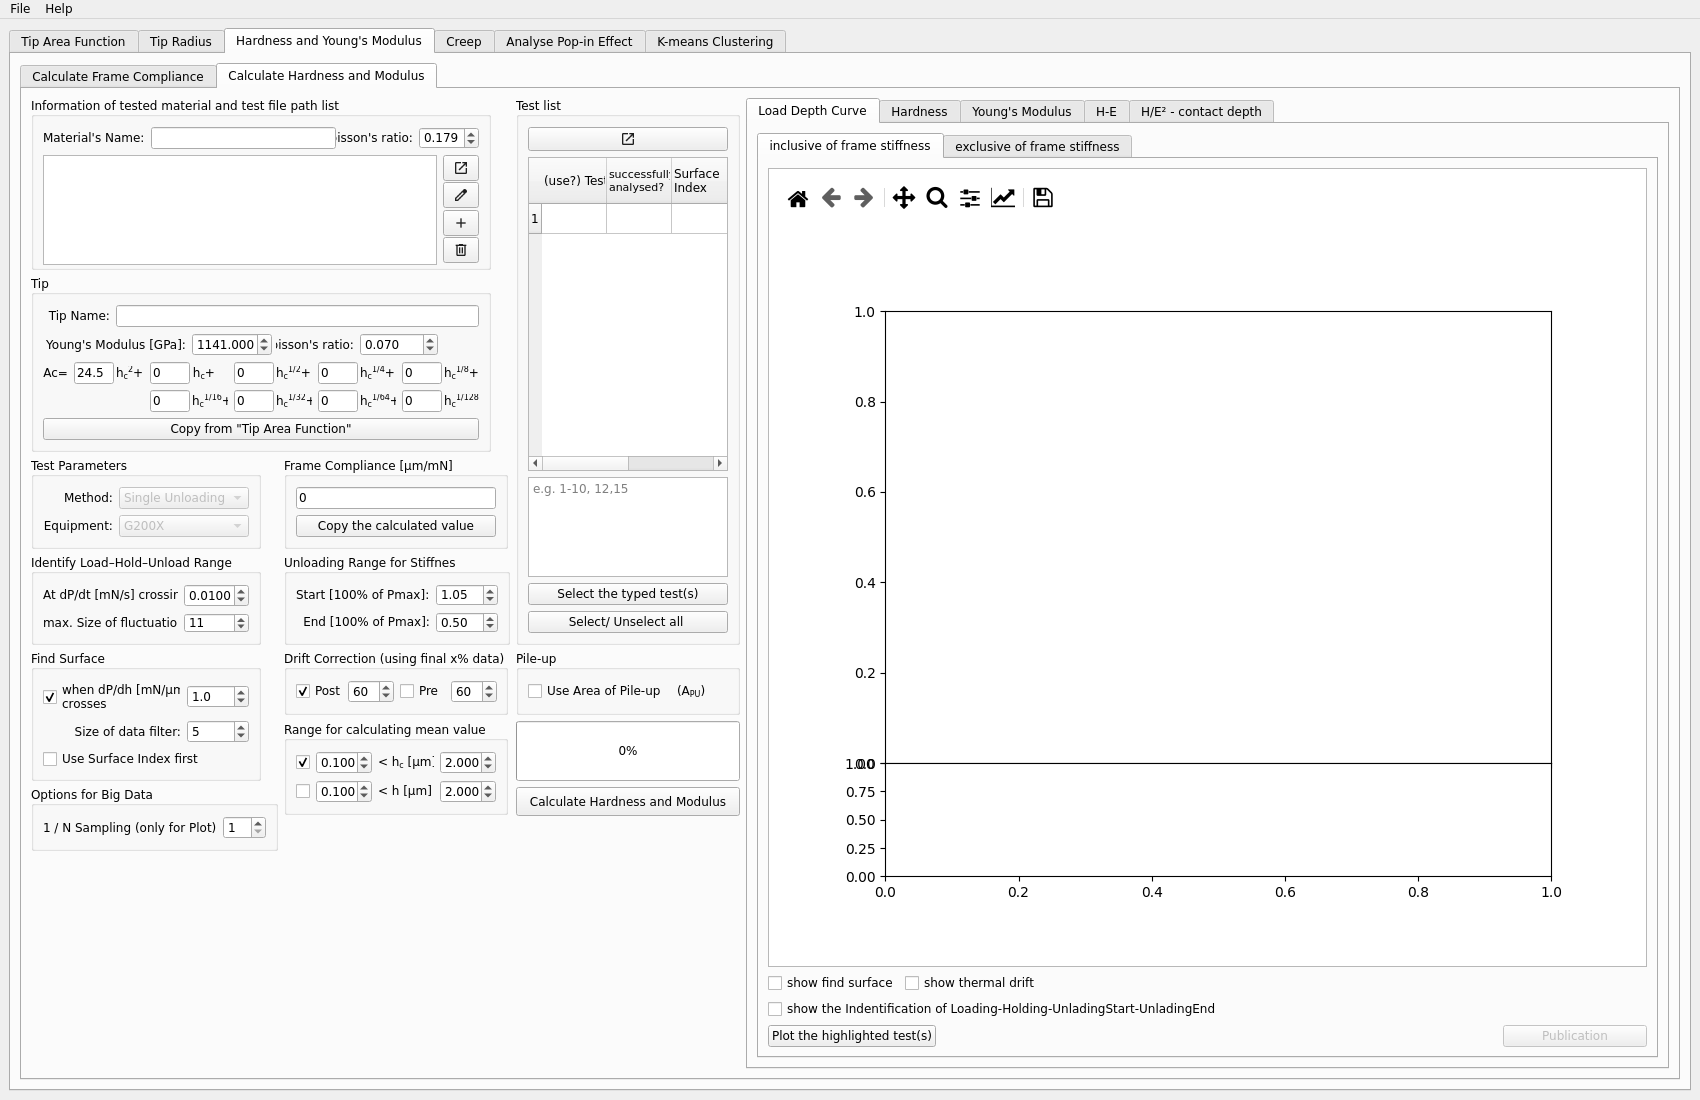
Typical steps
Load the test file or files.
Copy the calibrated TAF.
Copy the frame compliance.
Choose the mean-value range.
Run the calculation.
Inspect the plots and result tables.
Outputs to inspect
Typical plots include:
hardness vs contact depth
hardness vs depth
modulus vs contact depth
modulus vs depth
H-E related plots
Also check:
the mean-value range used for the reported values
whether the selected tests are the intended ones
whether the resulting values are stable across depth
Key plots
The most useful plots in this workflow are:
hardness vs contact depth
hardness vs depth
modulus vs contact depth
modulus vs depth
H-E related plots for comparing property relationships across tests
Common problems
Typical issues include:
forgetting to update TAF or frame compliance before running
using the wrong mean-value range
including unsuitable tests in the calculation
reading summary values without checking the plots
Next step
This tab is often the main analysis result for a project. It can also feed:
Creep, when additional time-dependent analysis is needed