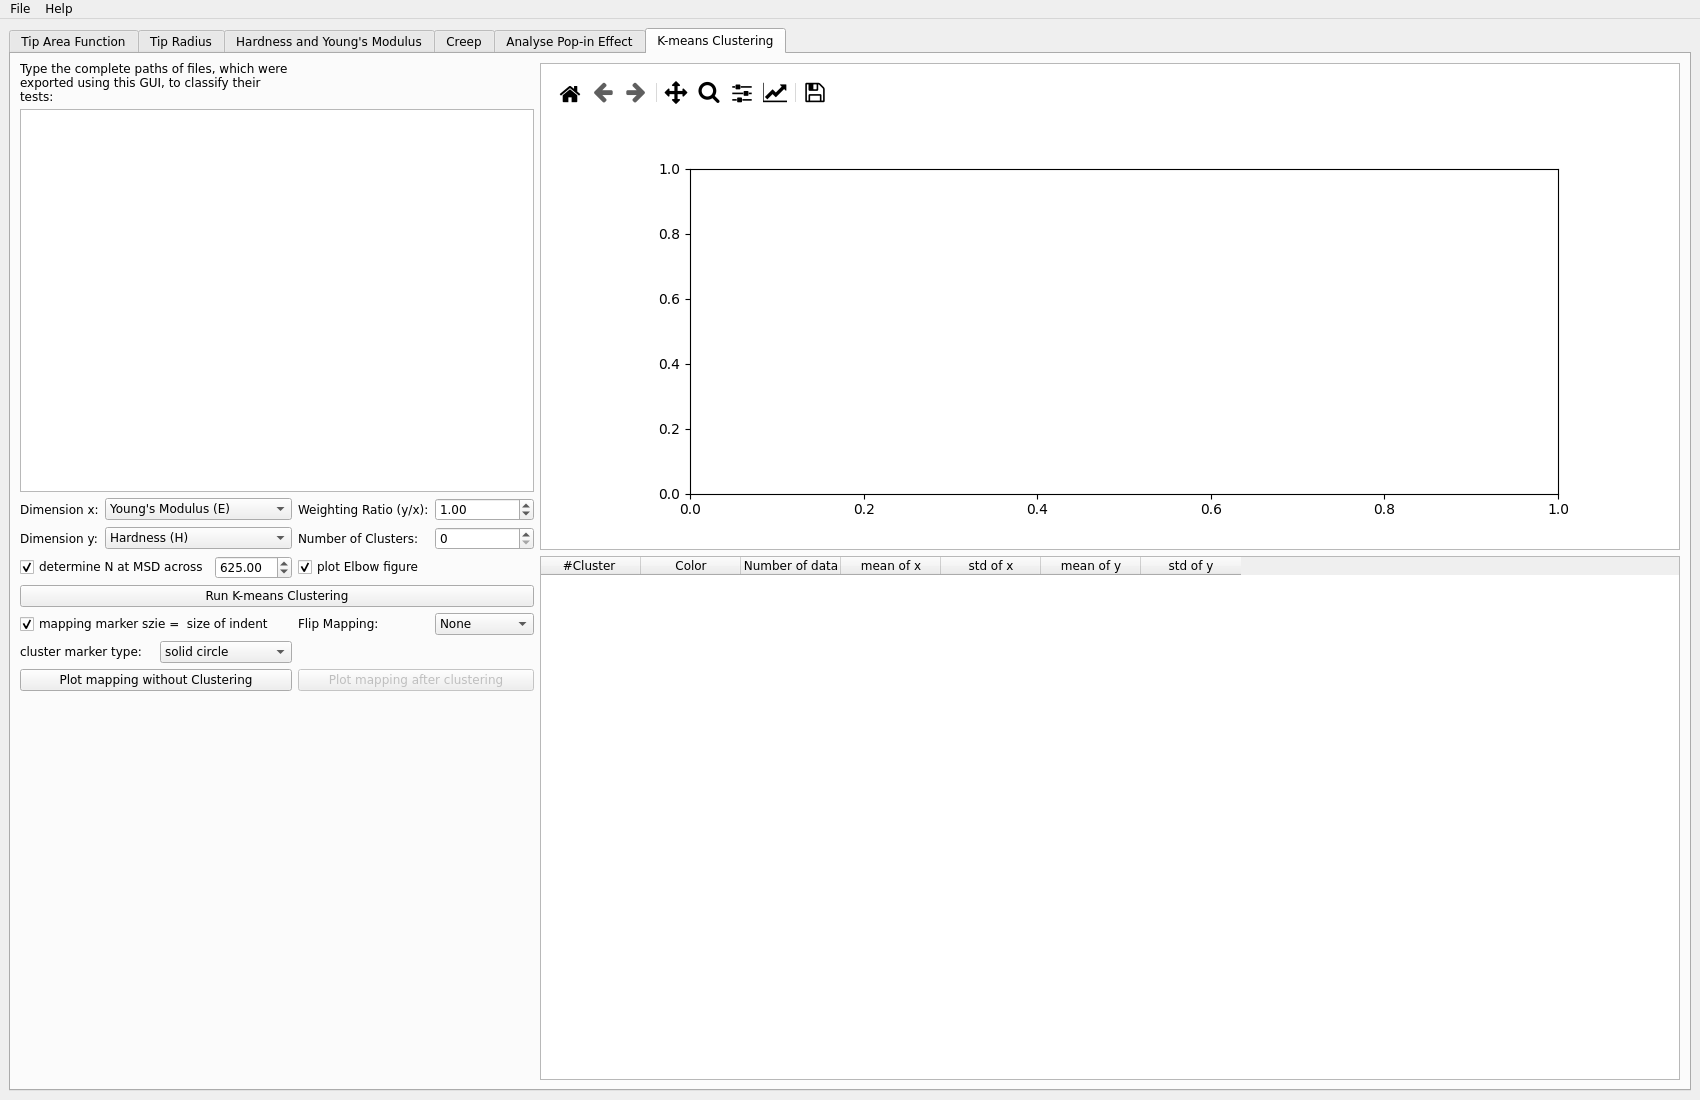
Classification
Use the K-means Clustering tab to cluster and map hardness/modulus data.
Inputs
multiple result files
clustering settings appropriate for your dataset
Typical steps
Load multiple result files.
Choose clustering settings.
Run classification.
Plot the mapping before and after clustering.
Outputs to inspect
Useful checks include:
whether the clusters are stable
whether the mapping matches the expected microstructural regions
whether the input hardness/modulus data were prepared consistently
Key plots
The key plots are:
the mapping before clustering
the mapping after clustering
any cluster-colored property plot that shows whether the clusters are physically meaningful
Common problems
Typical issues include:
mixing inconsistent input datasets
choosing clustering settings without checking the mapping
interpreting clusters without comparing them to the original data
Next step
Classification commonly produces a final analysis view, so the next step is usually export, reporting, or comparison with microscopy or phase information.