Verification
Compare pythonEBSD with OIM and mTex (TODO)
from ebsdlab.ebsd import EBSD
e = EBSD("../tests/DataFiles/EBSD.ang")
e.maskCI(0.001)
e.plotPF(size=1)
e.plotPF()
e.plotPF(proj2D='down-right')
Load .ang file:  ../tests/DataFiles/EBSD.ang
   Read file with step size: 0.2 0.2
   Optimal image pixel size: 103
   Number of points: 23909
   Duration init:  0 sec
Duration plotPF: 0 sec
Duration plotPF: 0 sec
Duration plotPF: 0 sec
description |
OIM software |
mTex software |
this python code |
|---|---|---|---|
IPF ND* |
|
|
|
IPF RD |
|
I cannot produce |
|
Issues from mTex:
.bmp (left): low color number when exporting from external window. .png works (right)
Explicitly select x-axis as North and z-axis as outOfPlane; normal orientation has different result, although it should be the same
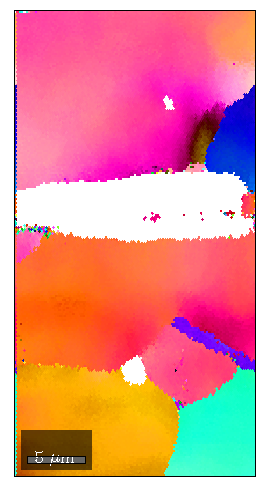
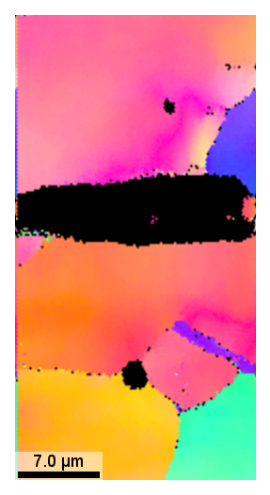
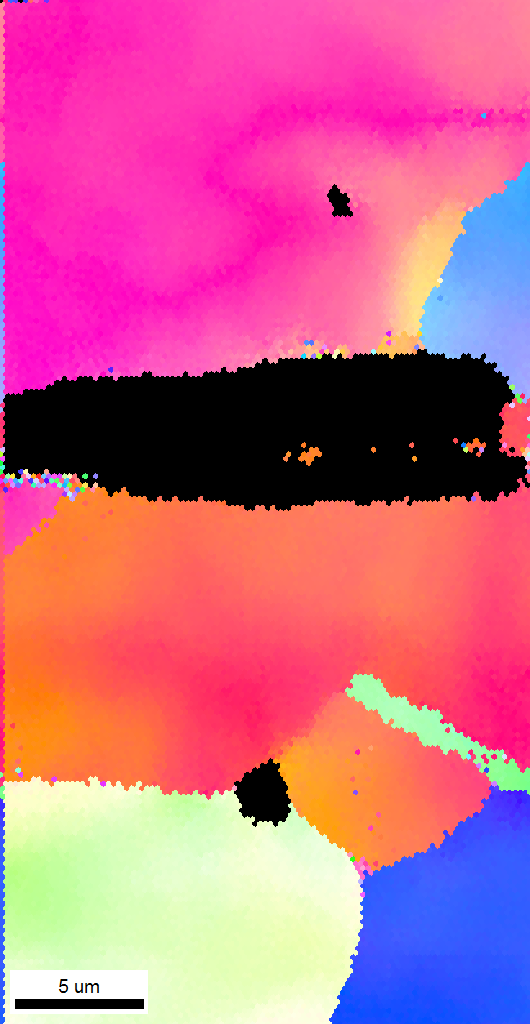
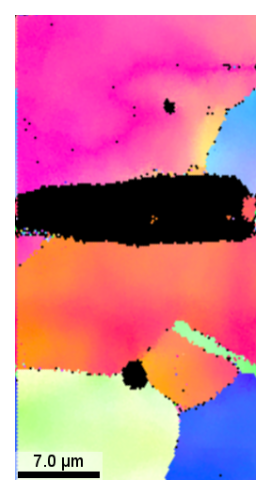
Compare the three software for bicrystal
description |
OIM software |
mTex software |
this python code |
|---|---|---|---|
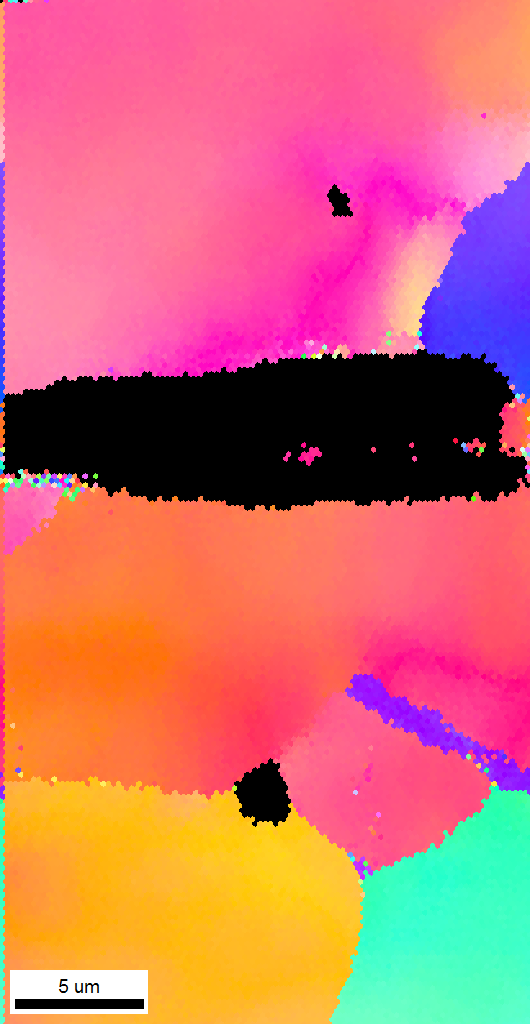
IPF ND* |
|
|
|
IPF RD |
|
I cannot produce |
|
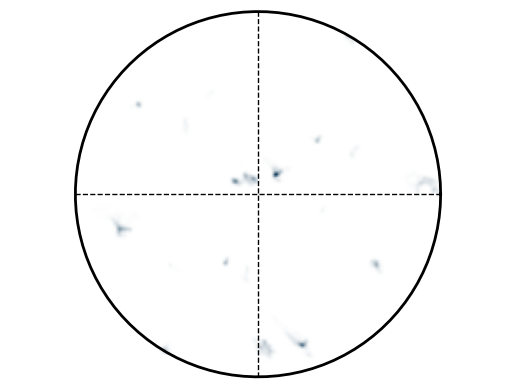
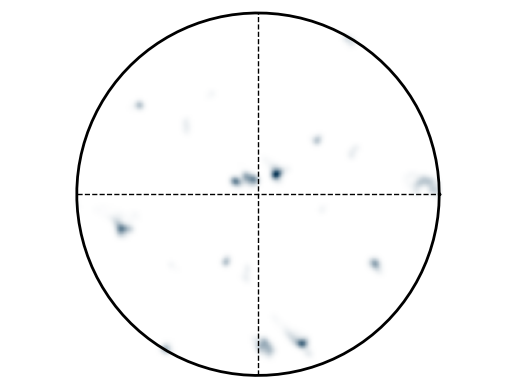
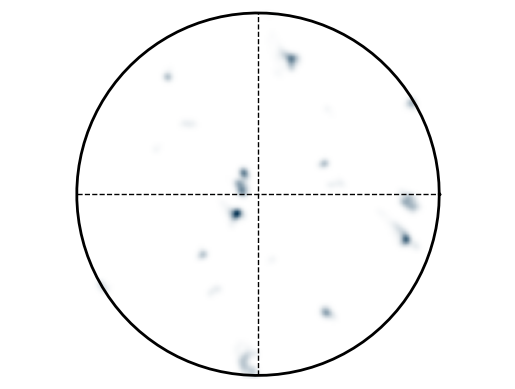
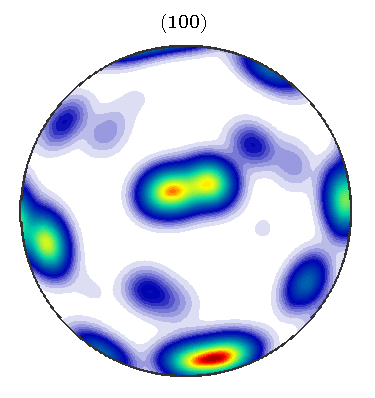
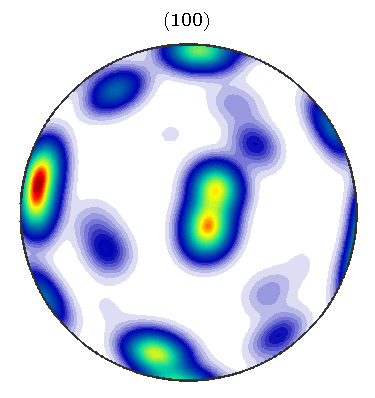
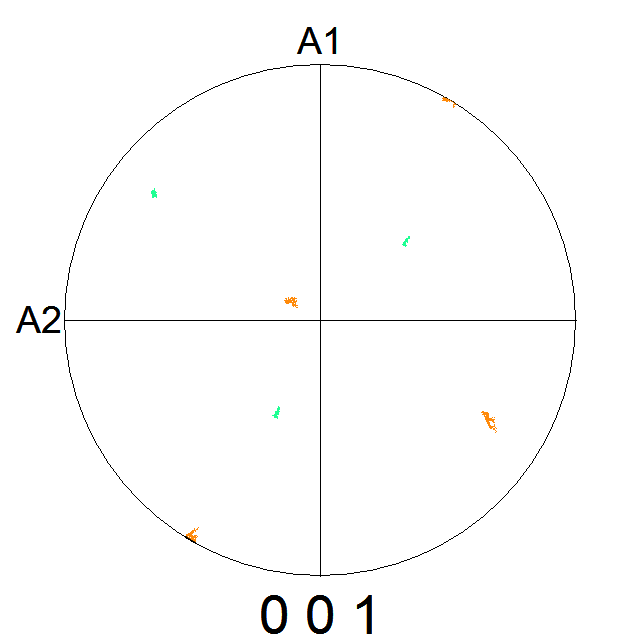
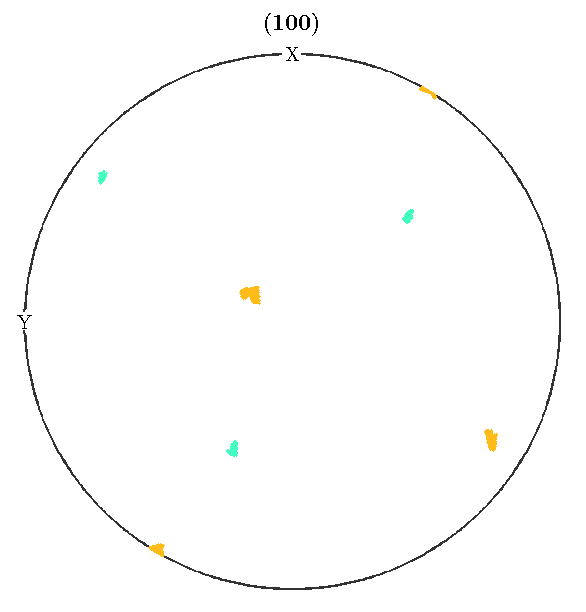
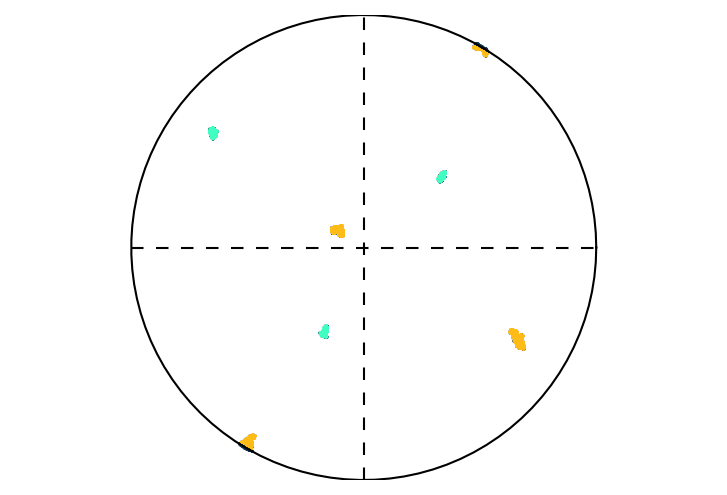
PF [100] |
|
|
|
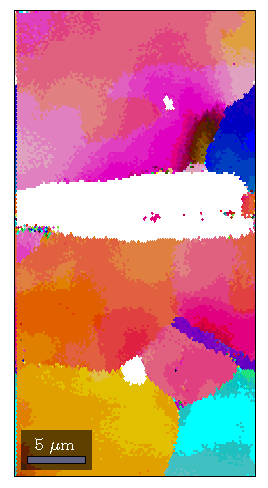
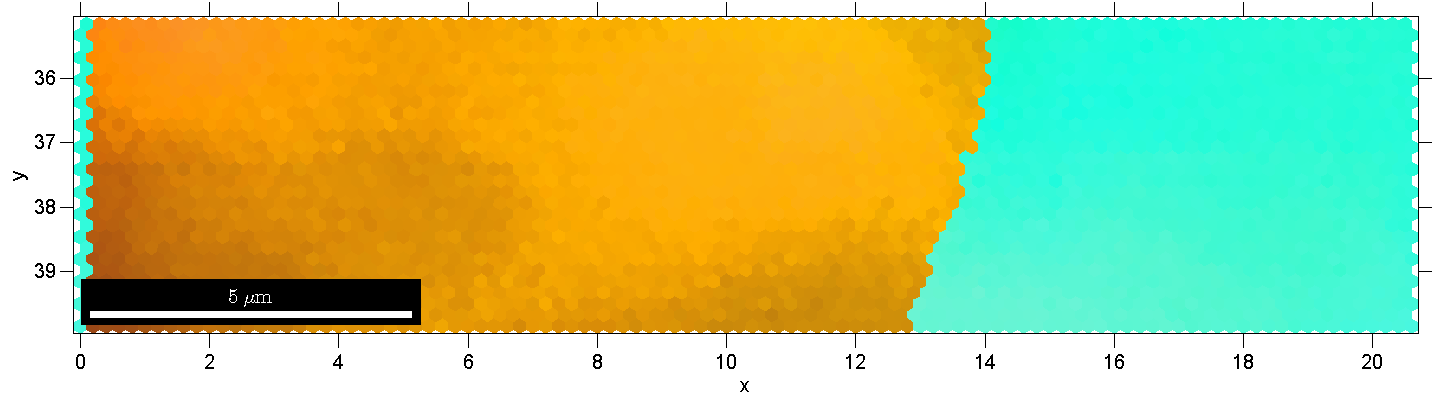
Python code:
from ebsdlab.ebsd import EBSD
e = EBSD("../tests/DataFiles/EBSD.ang")
e.cropVMask(ymin=35)
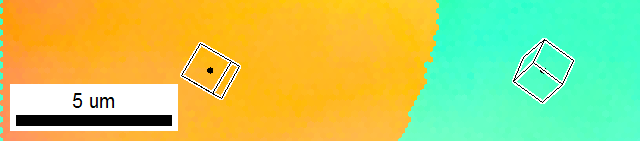
e.plotIPF("ND", fileName="doctest.png")
e.addSymbol(5,37, scale=2)
e.addSymbol(18,37, scale=2, fileName="doctest.png")
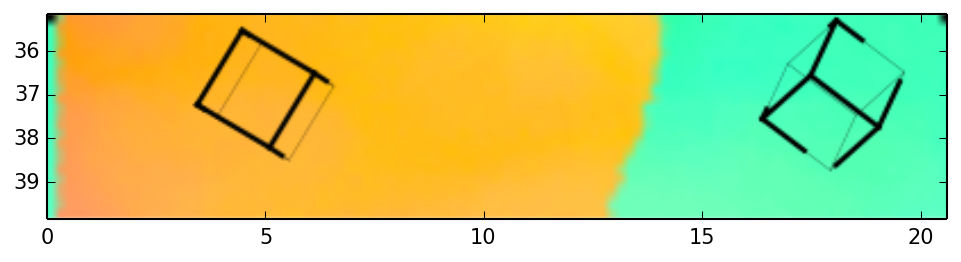
e.plotIPF("RD", fileName="pythonRD.png")
e.addSymbol(5,37, scale=2)
e.addSymbol(18,37, scale=2, fileName="pythonRD.png")
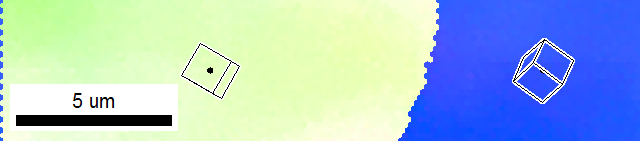
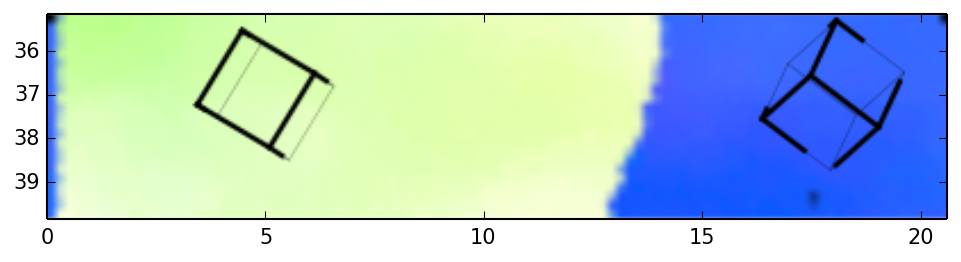
e.plotIPF("TD", fileName="pythonTD.png")
e.addSymbol(5,37, scale=2)
e.addSymbol(18,37, scale=2, fileName="pythonTD.png")
e.plotPF(fileName="pythonPF.png")
Note
The last image is not colored. This is not implemented yet. TODO
How to run mTex
>> startup_mtex
>> import_wizard('ebsd')
% and select EBSD.osc
% select plotting convention 5: x-to-right; y-to-bottom
% select "convert Euler 2 Spatial Reference Frame"
% save to workspace variable
>> csCopper = ebsd('Cu').CS;
>> plot(ebsd('Cu'),ebsd('Cu').orientations,'coordinates','on')
>> cS = crystalShape.cube(ebsd.CS)
>> region = [0 35 50 50];
>> ebsdC  = ebsd(inpolygon(ebsd,region))
>> plot(ebsdC('Cu'),ebsdC('Cu').orientations,'coordinates','on')
>> plotPDF(ebsd('Cu').orientations, Miller({1 0 0},csCopper))
% select xNorth zOutOfPlane as axis in mTex
>> plotPDF(ebsd('Cu').orientations, Miller({1 1 1},csCopper))
>> odf = calcODF(ebsd('Cu').orientations)
>> plotPDF(odf,Miller({1 0 0},csCopper) )
If separate window: save as png, because bmp colorscale is broken - if not separate window: save as bmp, because png crops sections off - select xNorth zOutOfPlane as axis in mTex - compare to original which should be the same
Data that exists and can be used for plotting in plot:
OIM software: - e.phi1, e.PHI, e.phi2 : Euler angles saved as quaternions - e.x, e.y : x,y coordinates - e.IQ, e.CI, e.phaseID : Image Quality, confidence index (bad=0 … good=1), phase id - e.SEMsignal : SEM signal - e.fit :
Oxford: - bc: band contrast
Hints for developers
run
./verifyAll.pyafter all changes to verify the code and create the html-documentationgit commands:
git add -A
git gui
git commit -m "solved symbolic link issue"
git push -u origin master